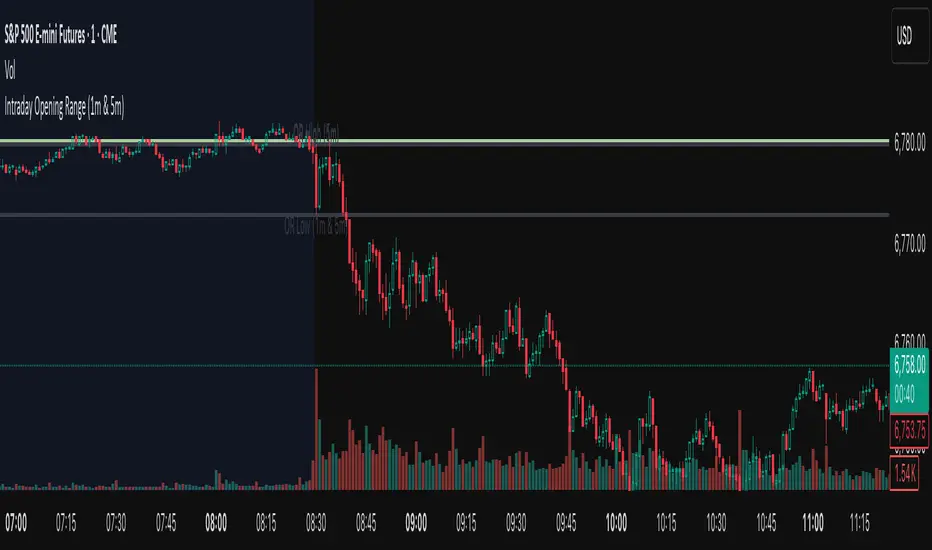
First 1-Minute Candle High/Low After Specific TimeDescription:
This indicator captures and marks the high and low of the first 1-minute candle after a specified time (default: 9:30 AM) and tracks the highs and lows of the first five candles. The levels marked by these initial candles are often critical in determining early session support and resistance, providing a visual guide for traders monitoring price action in the opening minutes of a trading session.
Key Features and Usage
1-Minute Candle High/Low: The indicator captures the high and low of the first 1-minute candle after the specified session start time. This level is marked with horizontal lines and labels, providing traders with an immediate reference for early-session price extremes.
5-Candle Range High/Low: After the first five candles, the indicator also highlights the highest and lowest levels within this range, offering additional support/resistance lines to aid in understanding early price movements.
Custom Labels and Dynamic Line Extension:
Labels update dynamically and display whether the 1-minute high/low coincides with the 5-minute range high/low, combining these labels if they match.
Horizontal lines extend to the current bar to remain visible throughout the session for consistent reference.
Customization Options
Colors and Label Text: Users can adjust colors for the 1-minute and 5-minute high/low lines and the label text for optimal readability.
Label Position Offset: Labels are placed slightly above or below their respective lines to avoid overlap with price action, maintaining clarity on the chart.
Intended Use
This indicator is especially useful for intraday traders focusing on opening range breakout strategies, scalping, or short-term trend analysis. It is intended for use on intraday charts (such as 1-minute or 5-minute intervals) and provides straightforward levels to assess early market structure.
Technical Details
Customization of Start Time: Users can change the default start time to any desired session opening time, adapting it to various markets or trading sessions.
Dynamic Line and Label Updates: Both lines and labels dynamically extend with the chart, while labels remain easy to read as they shift based on recent price action.
This script is designed to be simple yet powerful, offering key insights into session open levels without relying on predictive or lookahead features. It is useful for real-time analysis and adds value by helping traders identify critical levels in the market's early stages.
In den Scripts nach "high low" suchen
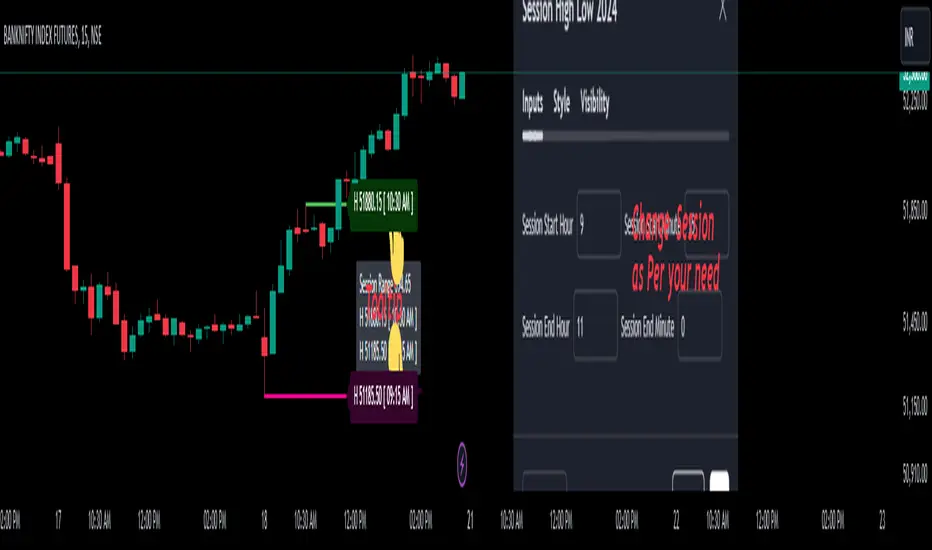
Session High Low 2024
Overview of the Code:
Input for Session Times:
You set up inputs for the start and end times of the trading session, allowing you to customize them as needed.
Time Range Function:
A function isTimeInRange checks whether the current time falls within the specified session start and end times.
initialize High and Low:
indicator initialize session high, low, and their corresponding labels and lines.
Tracking Session High and Low:
Within the specified time range, continuously update session1High and session1Low based on the highest and lowest prices encountered.
Time of Session High/Low:
The High_Time and Low_Time are tracked using the ta.valuewhen() function to capture the exact times when the session high and low occur.
Notes Creation:
You format the high and low values along with their timestamps to create notes that will be displayed alongside the lines.
Drawing Lines and Labels:
After the session ends, you check if there is a new session high or low and draw lines and labels accordingly. If a line or label already exists, you delete it before drawing a new one.
Resetting for Next Session:
At the end of the session, the high and low values are reset for the next session.
Suggestions for Improvement:
Dynamic Line Extensions:
Clear Variable Names Used in Code:
Consider using more descriptive names for variables like Entry_Point and SL_Point to make the code easier to understand.
Commenting:
Although the code is well-commented, always ensure the comments explain the "why" behind the code rather than just the "what."
Example Output:
The output will show the highest and lowest prices during the specified session times and the times they occurred formatted correctly. This output is useful for quick reference during trading and aids in making informed decisions.
Added functionality tool tip Note:
Added a tooltip Note to Get All information of Session High Low & Range.
If you need further modifications, enhancements, or specific functionalities added to this script, please let me know!
Enhanced High-Low Difference IndicatorEnhanced High-Low Difference Indicator
The "Enhanced High-Low Difference Indicator" is a powerful tool that highlights market volatility by tracking the difference between the high and low prices of a bar. Key features include:
Customizable Threshold: Set your own threshold for the high-low difference to filter out minor fluctuations.
Visual Highlights: Bars that exceed the threshold are highlighted with customizable color and opacity settings for easy identification.
Optional Labels: Display the exact high-low difference on the bars when the threshold is exceeded, with fully customizable label color and size.
High-Low Difference Line: Optionally plot a line that tracks the high-low difference of each bar for visual reference.
Alerts: Receive real-time alerts when the high-low difference exceeds your specified threshold.
Threshold Reference Line: Plot the threshold value as a horizontal reference line on the chart.
This indicator is ideal for traders looking to identify volatility spikes and make informed trading decisions based on price action.

Relative Equal Highs/LowsThis Pine script indicator is designed to create a visual representation of the relative equal highs & lows formed and automatically removed mitigated ones. Unlike indicators designed to show exact equal high/lows this indicator allows a small, configurable degree of variance between price to identify areas where price stops.
Relevance:
Relative Equal highs and lows can serve as valuable tools in identifying potential shifts in trend direction. They come into play when the price hits a support or resistance level and can’t advance further, signaling a possible reversal or pivot point. When the price sufficiently retreats from these levels, relative equal highs and lows can also indicate liquidity draws where buy/sell stops might be positioned, in accordance with SMC/ICT concepts.
How It Works:
The indicator tracks all unmitigated highs & lows within the chart’s present timeframe, limited to the user-defined max bars lookback for optimal performance. If the prices are within the configured variance they are marked as relatively equal and at that point are visually identified by a horizontal line, which connects the two (or more) points of price. Depending on configuration of the indicator, a line is rendered from the 1st, last or both values within the relatively equal range of price. A unique feature of this indicator is its ability to remove the line once the price mitigates the relative equal high/low by falling below the lows or rising above highs. This ensures the chart remains uncluttered and highlights only the currently relevant levels, setting it apart from other indicators providing similar functionality.
Configurability:
The indicator offers five style settings for complete customization of the lines that represent equal highs/lows. These settings include line style, color, and width, along with an option to extend the lines to the right of the chart for enhanced visibility of equal high/low levels. To optimize performance, the indicator allows users to configure the lookback length, determining how far back the price history should be examined. In most instances, the default setting of 500 bars proves more than adequate. Additionally, you can set thresholds via separate configs for stocks & indices that will determine if the price is relatively equal and lastly allow you to configure where the indicator line should be drawn, the first, last or all the values.
Additional notes:
This uses a different approach then my “equal highs/lows” indicator to identify price levels and because it focuses specifically on relative as opposed to exact values it is entirely different and may show “weaker”, but still important levels of liquidity. This indicator is more suited for analysis of stocks and indices or higher-timeframes where price-action rarely forms exact equal values instead more frequently forming almost equal values. My other indicator is more suited for smaller (15m or less) timeframe on indices where exact equal prices are often identical. Depending on situation different indicators should be used.

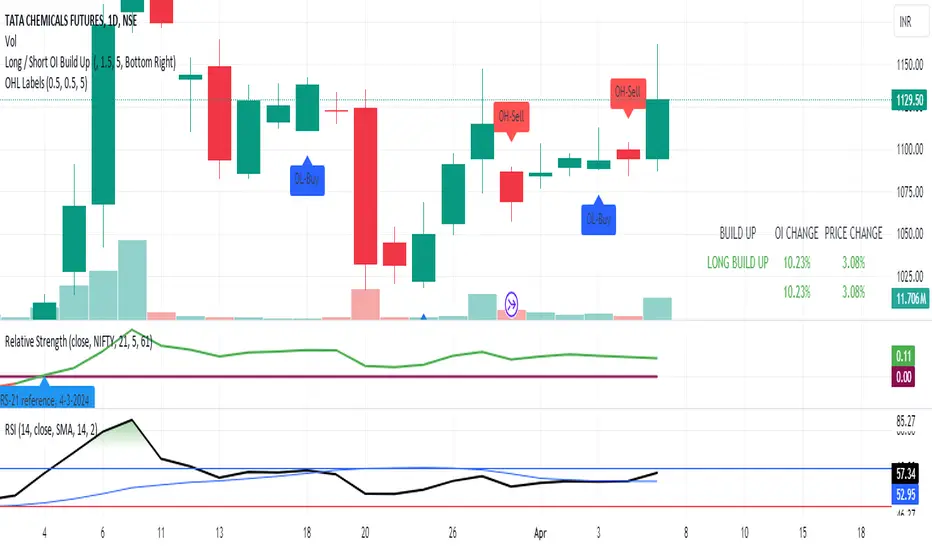
OPEN=HIGH/LOW LabelsIntroduction:
The "OPEN=HIGH/LOW Labels" script is designed to visually indicate instances where the opening price is equal to the high or low price of the candle. It overlays labels on the chart to highlight these conditions, providing traders with additional insights into price action.
Key Features:
Customizable Inputs: Traders can adjust parameters such as the maximum percentage difference between the opening price and the high/low prices, as well as the maximum number of labels to display.
Buy and Sell Conditions: The script defines conditions for both buy and sell scenarios based on whether the low price is equal to or greater than the opening price (indicating potential buying interest) or the high price is equal to or less than the opening price (indicating potential selling interest).
Limited Label Display: To prevent clutter on the chart, the script limits the number of labels displayed by removing older labels when the maximum number is reached.
Usage:
High Price Max % : Adjust this parameter to set the maximum percentage difference allowed between the opening price and the high price of the candle.
Low Price Max %: Set the maximum percentage difference allowed between the opening price and the low price of the candle.
Max Labels: Define the maximum number of labels to be displayed on the chart.
Interpretation:
OL-Buy Label: This label is displayed when the low price of the candle is equal to or greater than the opening price, indicating potential buying interest.
OH-Sell Label: This label is displayed when the high price of the candle is equal to or less than the opening price, suggesting potential selling interest.
Conclusion:
The "OPEN=HIGH/LOW Labels" script is a useful tool for traders to identify instances where the opening price aligns closely with the high or low price of a candle. By customizing parameters and interpreting the labels, traders can gain valuable insights into market sentiment and potential trading opportunities.
Multi-Timeframe High Low (@JP7FX)Multi-Timeframe High Low Levels (@JP7FX)
This Price Action indicator displays high and low levels from a selected timeframe on your current chart.
These levels COULD represent areas of potential liquidity, providing key price points where traders can target entries, reversals, or continuation trades.
Key Features:
Display high and low levels from a selected timeframe.
Customize line width, colors for high and low levels, and label text color.
Enable or disable the display of high levels, low levels, and labels.
Receive alerts when the price takes out high or low levels.
How to use:
It is important to note that using this indicator on it's own is not advisable. Instead, it should be combined with other tools and analysis for a more comprehensive trading strategy.
Possibly look to use my MTF Supply and Demand Indicator to look for zones to trade from at these levels?
If the price breaks above a high level, you might consider entering a long position, with the expectation that the price will continue to rise. Conversely, if the price breaks below a low level, you may think about entering a short position, anticipating further downward movement.
On the other hand, you can also use high or low levels to look for reversal trades, as these areas can represent attractive liquidity zones.
By identifying these key price points, you could take advantage of potential market reversals and capitalise on new trading opportunities.
Always remember to use this indicator in conjunction with other technical analysis tools for the best results.
Additionally, you can enable alerts to notify you when the price takes out high or low levels, helping you stay informed about significant price movements.
This indicator could be a valuable tool for traders looking to identify key price points for potential trading opportunities.
As always with the markets, Trade Safe :)

Historic High Lows AdaptiveThis will plot in the ticker opened:
-All-time High and Low
-1 Year High and Low
-6 Months High and Low
-3 Months High and Low
-1 Month High and Low
-1 Week High and Low
-Previous day High and Low
Colors, extending the line to the right, width, showing price tag are all parameters.
High and Low calculations are updated daily
Lines haves issues sometimes rendering when the candles are in a period too small.
Previous session High/Low – Asia London USA Overview
This indicator automatically plots the Previous Day’s (PD) session Highs and Lows for the Asia (Tokyo), London, and USA (New York) trading sessions.
Each session is color-coded for clarity:
🟩 Asia (Green)
🟥 London (Red)
🟦 USA (Blue)
At the close of each session, the indicator records that session’s high and low, draws horizontal lines across the chart, and labels them neatly in the center of each range — above the high and below the low for perfect visual balance.
⚙️ How It Works
The script continuously tracks the current high and low within each session.
When a session closes, those values are locked in as the PD High and PD Low.
Clean lines and centered labels are drawn immediately.
The labels automatically offset slightly above or below the line to avoid overlap, with user-controlled spacing.
This helps traders quickly identify where price interacts with the previous session’s structure, a core concept for many session-based and liquidity-based strategies.
🧭 Sessions and Timezones
Each market session runs in its native timezone, so you can align them perfectly to your chart or your preferred trading hours:
Asia Session: Default 08:30 – 11:00 (Australia/Adelaide time)
London Session: Default 08:00 – 10:00 (Europe/London)
USA Session: Default 09:30 – 16:00 (America/New_York)
You can change each session’s hours and timezone from the Inputs panel.
🎨 Customization
In the Inputs menu you can:
Toggle each session on or off
Choose line color and thickness
Enable or disable labels
Adjust vertical offset (ticks) for label spacing
“High label offset” – moves label further above the high line
“Low label offset” – moves label further below the low line
These adjustments make it easy to keep charts clean and readable on any instrument or timeframe.
📈 Practical Use
This indicator is ideal for:
Session traders who mark PD Highs/Lows as liquidity zones
London or NY session scalpers who watch for breakouts, fakeouts, or reversals
ICT / Smart Money Concepts users wanting automatic session reference levels
Anyone wanting a quick visual map of inter-session structure

Previous Day & Week High/Low LevelsPrevious Day & Week High/Low Levels is a precision tool designed to help traders easily identify the most relevant price levels that often act as strong support or resistance areas in the market. It automatically plots the previous day’s and week’s highs and lows, as well as the current day’s developing internal high and low. These levels are crucial reference points for intraday, swing, and even position traders who rely on price action and liquidity behavior.
Key Features
Previous Day High/Low:
The indicator automatically draws horizontal lines marking the highest and lowest prices from the previous trading day.
These levels are widely recognized as potential zones where the market may react again — either rejecting or breaking through them.
Previous Week High/Low:
The script also tracks and displays the high and low from the last completed trading week.
Weekly levels tend to represent stronger liquidity pools and broader institutional zones, which makes them especially important when aligning higher timeframe context with lower timeframe entries.
Internal Daily High/Low (Real-Time Tracking):
While the day progresses, the indicator dynamically updates the current day’s internal high and low.
This allows traders to visualize developing market structure, identify intraday ranges, and anticipate potential breakouts or liquidity sweeps.
Multi-Timeframe Consistency:
All levels — daily and weekly — remain visible across any chart timeframe, from 1 minute to 1 day or higher.
This ensures traders can maintain perspective and avoid losing track of key zones when switching views.
Customizable Visuals:
The colors, line thickness, and label visibility can be easily adjusted to match personal charting preferences.
This makes the indicator adaptable to any trading style or layout, whether minimalistic or detailed.
How to Use
Identify Key Reaction Zones:
Observe how price interacts with the previous day and week levels. Rejections, consolidations, or clean breakouts around these lines often signal strong liquidity areas or potential directional moves.
Combine with Market Structure or Liquidity Concepts:
The indicator works perfectly with supply and demand analysis, liquidity sweeps, order block strategies, or simply classic support/resistance techniques.
Scalping and Intraday Trading:
On lower timeframes (1m–15m), the daily levels help identify intraday turning points.
On higher timeframes (1h–4h or daily), the weekly levels provide broader context and directional bias.
Risk Management and Planning:
Using these levels as reference points allows for more precise stop placement, target setting, and overall trade management.
Why This Indicator Helps
Markets often react strongly around previous highs and lows because these zones contain trapped liquidity, pending orders, or institutional decision points.
By having these areas automatically mapped out, traders gain a clear and objective view of where price is likely to respond — without needing to manually draw lines every day or week.
Whether you’re a beginner still learning about price structure, or an advanced trader refining entries within liquidity zones, this tool simplifies the process and keeps your charts clean, consistent, and data-driven.

True High/Low RSI for DivergenceThis Pine Script creates a highly specialized RSI (Relative Strength Index) indicator designed to provide a more accurate signal for divergence trading. Its official title is "True High/Low RSI for Divergence."
Here is a breakdown of its core features:
1. Dual RSI Calculation based on Highs and Lows:
Unlike a standard RSI that typically uses the closing price of a candle, this indicator calculates two separate RSI lines:
A "High RSI" : This line calculates the RSI based on the high price of each candle. It is intended to track momentum peaks more accurately.
A "Low RSI" : This line calculates the RSI based on the low price of each candle. It is designed to track momentum troughs more accurately.
The main purpose of this separation is to avoid the potential errors that can occur when using an average price (like the close or hl2) during periods of high volatility. By using the true extremes of the price candles, the indicator aims to show a more "true" representation of momentum for identifying divergences between price and the indicator.
2. Dynamic Transparency:
This is a key visual feature. The RSI lines are not always fully visible. They dynamically fade into view as they enter significant overbought or oversold zones:
The Low RSI line (red by default) is invisible when above a value of 50. As it drops from 49 towards 30, it becomes progressively more opaque (more visible). It reaches full opacity at an RSI value of 30, visually alerting the user to strengthening oversold conditions.
The High RSI line (blue by default) is invisible when below a value of 50. As it rises from 51 towards 70, it also becomes progressively more opaque. It is fully opaque at an RSI value of 70, highlighting strengthening overbought conditions.
3. User Customization:
The script allows for user flexibility. You can change:
The colors for both the High and Low RSI lines.
The RSI calculation length (default is 14).
The price source for each RSI line (though they are specifically designed to use high and low).
In summary, this indicator is a purpose-built tool for traders who rely on divergence. It provides a more precise and visually intuitive way to track momentum at its true peaks and troughs, helping to make more informed trading decisions.
Asian & London Session Highs/LowsAsian & London Session Highs/Lows with Extendable Lines
This TradingView script automatically marks the highs and lows of the Asian and London trading sessions for the most recent day, allowing traders to identify key levels during these active periods. The lines representing the high and low of each session are drawn at the exact price point where the high/low occurred, and they extend to the right for a customizable number of bars, helping to visualize how the price reacts to these key levels after the session ends.
Key Features:
Session High/Low Tracking: Automatically tracks the highest and lowest points for the Asian and London sessions.
Extendable Lines: Lines start at the exact bar where the high/low occurred and can be extended to the right for a specified number of bars.
Timezone Adjustment: Allows you to input a timezone offset to adjust session times based on your local time or desired market time zone.
Customizable Colors & Line Thickness: Adjust the color and thickness of the session high and low lines to suit your visual preferences.
Clear & Precise Levels: Helps identify important support and resistance levels, making it easier to spot market reactions around session highs and lows.
This indicator is perfect for day traders and those looking to trade during specific market hours, offering clear visual markers of session boundaries and critical price levels.
NFP High/Low Levels PlusNFP High/Low Levels Plus
Description:
This indicator stores the 12 most recent NFP (Non-Farm-Payroll) days and their values.
Values are captured from 0830 (NFP Release) until close of market
The High and Low values for each NFP month are drawn on the chart with horizontal lines.
- Labels indicating the month's high or low line are placed after the line
- Optionally the high/low price can be displayed additionally
Support and Resistance boxes can be drawn at the closest NFP level above and below the
current price.
- Boxes will automatically update as prices cross the NFP value
Macro Indicator
- This option displays a small table in the top right corner that says "Up" or " Down"
- The Macro Indicator can be used to judge the potential direction for the current month
- Macro direction is calculated by the following:
- UP: If two consecutive days both open and close above the most recent NFP High level
- DOWN: If two consecutive days both open and close below the most recent NFP Low level
Micro Indicator
- This option displays a small table in the top right corner that says "Up" or " Down"
- The Micro Indicator can be used to judge the potential direction for low timeframes 1H or
lower
- Micro direction is calculated by the following:
- UP: If two consecutive 10m candles close above the 20EMA
- DOWN: If two consecutive 10m candles close below the 20EMA
NFP Session Bars
- This feature draws an arrow at the bottom of the chart for each candle that falls within the
NFP session day
- This is useful for identifying NFP Days
Support / Resistance Table
- This displays a table bottom center showing the nearest high and low NFP line level
What is an NFP Day and why is it useful to add to my chart?
- NFP Days are one of the most important data releases monthly
- NFP (Non-Farm-Payroll) is the official release of 80% of the US workforce employed in
manufacturing, construction, and goods
- It does not include those who work on farms, private households, non-profit and
government workers
- Historically these high/low levels for the day create strong support and resistance levels
- Having them displayed on the chart can help identify potential strong levels and pivot points
Full Indicator with all options enabled and identified
Easily update NFP Release Days in the indicator settings
Modify various options: Show/Hide lines, labels, directional indicator tables, values tables
Adjust line width, offsets, colors, font sizes, box widths
Enable individual Directional Indicators and modify colors
Example of full indicator enabled
You can find a list of the NFP Release Schedule on the official US Bureau of Labor Statistics website. This is useful for updating the indicator settings with the correct dates

Swing High/Low (ZigZag) [ChartPrime]Swing High/Low (ZigZag) Indicator
The Swing High/Low (ZigZag) Indicator is a versatile tool for identifying and visualizing price swings, swing highs, and swing lows. It dynamically plots levels for significant price points while connecting them with a ZigZag line, enabling traders to analyze market structure and trends with precision.
⯁ KEY FEATURES
Swing Highs and Lows Detection
Accurately detects and marks swing highs and lows, providing a clear structure of market movements.
Real-Time ZigZag Line
Connects swing points with a dynamic ZigZag line for a visual representation of price trends.
Customizable Swing Sensitivity
Swing length input allows traders to adjust the sensitivity of swing detection to match their preferred market conditions.
Swing Levels with Shadows
Option to display swing levels with extended shadows for better visibility and market analysis.
Broken Levels Marking
Tracks and visually updates levels as dashed lines when broken, providing insights into shifts in market structure.
Swing Direction Display
At the top-right corner, the indicator displays the current swing direction (up or down) with a directional arrow for quick reference.
Interactive Labels
Marks swing levels with labels, showing the price of swing highs and lows for added clarity.
Dynamic Market Structure Analysis
Automatically adjusts ZigZag lines and levels as the market evolves, ensuring real-time updates for accurate trading decisions.
⯁ HOW TO USE
Analyze Market Trends
Use the ZigZag line and swing levels to identify the overall direction and structure of the market.
Spot Significant Price Points
Swing highs and lows act as potential support and resistance levels for trading opportunities.
Adjust Swing Sensitivity
Modify the swing length setting to match your trading strategy, whether scalping, day trading, or swing trading.
Monitor Broken Levels
Use the dashed lines of broken levels to identify changes in market dynamics and potential breakout or breakdown zones.
Plan Entries and Exits
Leverage swing levels and direction to determine optimal entry, stop-loss, and take-profit points.
⯁ CONCLUSION
The Swing High/Low (ZigZag) Indicator is a powerful tool for traders seeking to visualize price swings and market structure. Its real-time updates, customizable settings, and dynamic swing direction make it an invaluable resource for technical analysis and decision-making.

Breakout Detector (Previous MTF High Low Levels) [LuxAlgo]The Breakout Detector (Previous MTF High Low Levels) indicator highlights breakouts of previous high/low levels from a higher timeframe.
The indicator is able to: display take-profit/stop-loss levels based on a user selected Win/Loss ratio, detect false breakouts, and display a dashboard with various useful statistics.
Do note that previous high/low levels are subject to backpainting, that is they are drawn retrospectively in their corresponding location. Other elements in the script are not subject to backpainting.
🔶 USAGE
Breakouts occur when the price closes above a previous Higher Timeframe (HTF) High or below a previous HTF Low.
On the advent of a breakout, the closing price acts as an entry level at which a Take Profit (TP) and Stop Loss (SL) are placed. When a TP or SL level is reached, the SL/TP box border is highlighted.
When there is a breakout in the opposite direction of an active breakout, previous breakout levels stop being updated. Not reaching an SL/TP level will result in a partial loss/win,
which will result in the box being highlighted with a dotted border (default). This can also be set as a dashed or solid border.
Detection of False Breakouts (default on) can be helpful to avoid false positives, these can also be indicative of potential trend reversals.
This indicator contains visualization when a new HTF interval begins (thick vertical grey line) and a dashboard for reviewing the breakout results (both defaults enabled; and can be disabled).
As seen in the example above, the active, open breakout is colored green/red.
You can enable the setting ' Cancel TP/SL at the end of HTF ', which will stop updating previous TP/SL levels on the occurrence of a new HTF interval.
🔶 DETAILS
🔹 Principles
Every time a new timeframe period starts, the previous high and low are detected of the higher timeframe. On that bar only there won't be a breakout detection.
A breakout is confirmed when the close price breaks the previous HTF high/low
A breakout in the same direction as the active breakout is ignored.
A breakout in the opposite direction stops previous breakout levels from being updated.
Take Profit/Stop Loss, partially or not, will be highlighted in an easily interpretable manner.
🔹 Set Higher Timeframe
There are 2 options for choosing a higher timeframe:
• Choose a specific higher timeframe (in this example, Weekly higher TF on a 4h chart)
• Choose a multiple of the current timeframe (in this example, 75 minutes TF on a 15 min chart - 15 x 5)
Do mind, that when using this option, non-standard TFs can give less desired timeframe changes.
🔹 Setting Win/Loss Levels
The Stop Loss (SL) / Take Profit (TP) setting has 2 options:
W%:L% : A fixed percentage is chosen, for TP and SL.
W:L : In this case L (Loss-part) is set through Loss Settings , W (Win-part) is calculated by multiplying L , for example W : L = 2 : 1, W will be twice as large as the L .
🔹 Loss Settings
The last drawing at the right is still active (colored green/red)
The Loss part can be:
A multiple of the Average True Range (ATR) of the last 200 bars.
A multiple of the Range Cumulative Mean (RCM).
The Latest Swing (with Length setting)
Range Cumulative Mean is the sum of the Candle Range (high - low) divided by its bar index.
🔹 False Breakouts
A False Breakout is confirmed when the price of the bar immediately after the breakout bar returns above/below the breakout level.
🔹 Dashboard
🔶 ALERTS
This publication provides several alerts
Bullish/Bearish Breakout: A new Breakout.
Bullish/Bearish False Breakout: False Breakout detected, 1 bar after the Breakout.
Bullish/Bearish TP: When the TP/profit level has been reached.
Bullish/Bearish Fail: When the SL/stop-loss level has been reached.
Note that when a new Breakout causes the previous Breakout to stop being updated, only an alert is provided of the new Breakout.
🔶 SETTINGS
🔹 Set Higher Timeframe
Option : HTF/Mult
HTF : When HTF is chosen as Option , set the Higher Timeframe (higher than current TF)
Mult : When Mult is chosen as Option , set the multiple of current TF (for example 3, curr. TF 15min -> 45min)
🔹 Set Win/Loss Level
SL/TP : W:L or W%:L%: Set the Win/Loss Ratio (Take Profit/Stop Loss)
• W : L : Set the Ratio of Win (TP) against Loss (SL) . The L level is set at Loss Settings
• W% : L% : Set a fixed percentage of breakout price as SL/TP
🔹 Loss Settings
When W : L is chosen as SL/TP Option, this sets the Loss part (L)
Base :
• RCM : Range Cumulative Mean
• ATR : Average True Range of last 200 bars
• Last Swing : Last Swing Low when bullish breakout, last Swing High when bearish breakout
Multiple : x times RCM/ATR
Swing Length : Sets the 'left' period ('right' period is always 1)
Colours : colour of TP/SL box and border
Borders : Style border when breakout levels stop being updated, but TP/SL is not reached. (Default dotted dot , other option is dashed dsh or solid sol )
🔹 Extra
Show Timeframe Change : Show a grey vertical line when a new Higher Timeframe interval begins
Detect False Outbreak
Cancel TP/SL at end of HTF
🔹 Show Dashboard
Location: Location of the dashboard (Top Right or Bottom Right/Left)
Size: Text size (Tiny, Small, Normal)
See USAGE/DETAILS for more information

52 Week High/Low FibonacciThe primary purpose of this indicator is to calculate and plot the 52-week high and low prices along with the Fibonacci retracement levels on the price chart. Fibonacci levels are commonly used in trading to identify potential support, resistance, and price reversal points.
First, the script initializes the Fibonacci levels and their corresponding colors, which will be used to plot the levels on the chart. Next, it calculates the 52-week high and low prices by finding the highest and lowest prices over the last 252 trading days, approximately equivalent to one year. Then, it identifies the overall trend direction by comparing the number of bars since the highest high and the lowest low. If the highest high is more recent, the trend is considered downwards; if the lowest low is more recent, the trend is upwards.
The script then plots the Fibonacci retracement levels on the chart, using horizontal lines at the respective price levels. It also creates labels for each level, displaying the percentage and the price value. Additionally, it draws a line connecting the 52-week high and low prices, providing a visual representation of the price range during the 52-week period.
Pros of this indicator include:
-Automatic calculation and plotting of Fibonacci levels, saving time for traders
-Clear trend identification based on 52-week high and low prices
-Visually appealing and easy-to-read chart representation with color-coded levels
-Provides insight into potential price reversal areas based on widely used Fibonacci levels
Cons of this indicator include:
-Only works on daily timeframes, limiting its usefulness for intraday and weekly traders
-Assumes that the trend will continue in the same direction, which may not always be accurate in real-world markets
-Does not provide explicit buy or sell signals, leaving the trading decision-making process up to the trader
-Solely relies on Fibonacci levels, which may not always be accurate; it is recommended to use other technical indicators or strategies alongside this indicator for a comprehensive trading approach
In conclusion, the '52 Week High Low Fibonacci' indicator is a valuable tool for traders interested in using Fibonacci levels for identifying potential price reversal points. By automatically calculating and plotting these levels based on 52-week high and low prices, the indicator provides a clear, color-coded visual aid, which can be especially helpful for traders who base their strategies on these levels.
However, it's worth noting that this indicator is limited to daily timeframes and doesn't provide explicit buy or sell signals, requiring traders to incorporate their own analysis and judgement in their decision-making process. The indicator also operates on the assumption of trend continuation, which may not always hold true.
While it's a beneficial tool, relying solely on this indicator for trading decisions may not be advisable. It's best used in conjunction with other indicators and trading strategies, providing a more balanced and comprehensive approach to trading in the financial markets. As always, risk management should be a key part of any trading strategy.
**YOUR INSIGHTFUL FEEDBACK OR SUGGESTIONS FOR REVISIONS TO THIS CODE ARE HIGHLY APPRECIATED. PLEASE FEEL FREE TO SHARE YOUR THOUGHTS TO FOSTER ITS CONTINUAL IMPROVEMENT**

Filter-Out Weak Pivot highs/lows, Swing highs/lows: MethodJust a simple indicator for refining the standard method of finding Pivot highs & Lows; Allowing user to filter-out weak/flat/rounded Pivot highs/lows
-Aim of this is to get pivot highs & pivot lows coded to print more in line with what the eye would naturally be drawn to as an obvious pivot high/low.
-This uses local moving average around the pivot high/low together with user-input ATR multiple, to create a condition for filtering out lacklustre pivot highs/lows.
-Thought i'd publish this separately as a tool that other coders might find useful.
//inputs//
~adjust looback/lookforward for Pivot highs/lows
~adjust 'spikiness' index to filter out less impressive pivot highs/lows (higher number = more selective)
NY 9:30-9:35 High/Low Range📘 Script Description
This script automatically identifies and plots the high and low of the 5-minute candle formed between 9:30 AM and 9:35 AM New York time, which corresponds to the opening of the U.S. equity market.
The goal is to provide a clear reference level for intraday volatility, directional bias, and breakout levels.
🔍 Function Overview
■ 1. Detects the 9:30–9:35 NY Time Candle
The script converts chart timestamps into New York session time and automatically captures the 5-minute candle that forms between:
NY 9:30:00 → NY 9:35:00
■ 2. Automatically Draws Horizontal Lines
After identifying the high and low of this candle, the script draws:
High line → Red
Low line → Blue
Lines start exactly at the 9:30 timestamp
Lines extend 3 hours into the future (until NY 12:30)
Lines do not extend beyond 3 hours (prevents unwanted diagonal lines or lines from previous days)
■ 3. Label Display at NY 20:00
The script places a label at New York 20:00, marking:
“9:30 High” for the high line
“9:30 Low” for the low line
This allows you to instantly identify the key reference levels at the end of the trading day.
■ 4. Auto-Removal at NY 20:00
At NY 20:00, both the lines and the labels are automatically deleted.
No old lines remain on the chart, ensuring clarity and accuracy for each new trading day.
🎯 Purpose and Use Cases
This script is highly useful for:
Determining intraday direction after the NY open
Tracking volatility spikes at the U.S. equity market open
Identifying breakout levels
Using high/low as dynamic support and resistance throughout the day
Understanding market context during economic events or high-impact sessions
The 9:30–9:35 range is one of the most watched price zones in global markets, often serving as the day’s initial liquidity sweep.
📝 Key Features
Accurate New York time conversion
Clean horizontal lines (no previous-day diagonal lines)
Labels positioned clearly at NY 20:00
No unnecessary visuals—simple and effective
Lightweight script with minimal chart impact

Crypto Anchored VWAP (Swing High/Low)Crypto Anchored VWAP (Swing High/Low)
This indicator provides an automatic Anchored VWAP system designed specifically for highly volatile assets such as cryptocurrencies (ETH, BTC, SOL, etc.).
Unlike traditional AVWAP tools that require manual date input, this script automatically anchors VWAP to the most recent swing high and swing low, making it ideal for real-time trend tracking and intraday/4H structure analysis.
How It Works
The script detects local swing lows and swing highs based on user-defined swing length.
When a new swing point appears, an Anchored VWAP is initialized from that specific candle.
As price evolves, the AVWAP dynamically becomes:
A trend boundary
A fair-value line
A mean-reversion attractor
Traders can use these levels to identify:
Trend continuation
Breakout confirmation
Mean reversion pullbacks
Overextended expansions
Included Features
✔ Auto-Anchored VWAP from swing low
✔ Auto-Anchored VWAP from swing high
✔ Standard deviation bands (1σ) for volatility context
✔ Designed for Crypto 4H / 1H / 15m
✔ Works on any asset & any timeframe
How To Use
1. Trend Direction
Price above Swing-Low VWAP → Bullish bias
Price below Swing-High VWAP → Bearish bias
2. Trade Setups
Break → Retest → Hold above AVWAP = Trend continuation long
Reject from AVWAP / σ band = Mean-reversion short setup
AVWAP zone → High probability liquidity reaction
3. Volatility Bands
Price touching +1σ = extension
Price returning to 0σ = mean reversion
Price breaking −1σ = trend weakening
Inputs
Swing Length: determines sensitivity of swing high/low detection
(Default: 5)
Best Use Cases
ETH 4H trend following
BTC structure shifts
Altcoin volatility filtering
Identifying institutional "cost basis" zones
Confirming breakouts / fakeouts
Notes
This is not a trading system by itself but a structural tool meant to help traders understand trend and value location. Always combine AVWAP with market structure, volume, and risk management.
Disclaimer
This script is for educational and informational purposes only. It does not constitute financial advice or a recommendation to buy or sell any asset. Use at your own discretion.

Equal Highs/Lows Multi-Pivot [Julio]Equal Highs/Lows Multi-Pivot
Description
A sophisticated multi-timeframe pivot analysis tool that detects and highlights equal highs and equal lows across four different pivot lengths simultaneously. This indicator identifies price levels where the market creates identical extremes, a powerful signal of institutional support/resistance and potential reversal or breakout zones.
How It Works
Four Independent Pivot Streams
Pivot 1 (Intraday - 2 bars): Ultra-fast level detection for scalpers
Pivot 2 (Session - 4 bars): Short-term swing levels
Pivot 3 (Daily - 6 bars): Medium-term structural levels
Pivot 4 (Weekly - 9 bars): Long-term institutional levels
Equal High (EQH) Detection
Compares consecutive swing highs and draws a line when two highs are nearly identical within a defined threshold. The indicator uses ATR-based confluence to determine "equality," filtering out noise while catching true market structure.
Equal Low (EQL) Detection
Same logic applied to swing lows, identifying support zones where price repeatedly fails to break below previous lows.
Key Features
Four Simultaneous Timeframes: Analyze intraday, session, daily, and weekly structures all on one chart
ATR-Based Confluence Threshold: Automatically adjusts sensitivity based on current volatility (no fake signals)
Color-Coded Levels: Each pivot length has distinct colors for instant visual identification
Highs: Red, Orange, Yellow, Fuchsia
Lows: Green, Blue, Aqua, Purple
Confirmation Mode: Optional setting to wait for full pivot confirmation before marking levels
Customizable Alert Zones: Toggle individual pivot lengths on/off to reduce clutter
Smart Label Positioning: Labels auto-center between the two equal pivots for clarity
Ideal For
Swing traders tracking support/resistance across multiple timeframes
Scalpers identifying micro-structure for quick entries and exits
Market structure analysts studying institutional price action patterns
Multi-timeframe traders needing confluence from intraday to weekly levels
Anyone trading 1-minute to 4-hour charts
Trading Applications
Identify strong support/resistance zones: Equal levels = confirmed institutional levels
Confirm trend reversals: Multiple equal lows = strong accumulation zone; multiple equal highs = distribution
Plan entries with precision: Enter near equal levels for higher probability setups
Detect liquidity concentration: Where price repeatedly tests the same level
Multi-timeframe confluence: Look for equal levels across multiple pivot lengths for ultra-strong zones
How to Use
Identify the equal levels: Color-coded lines instantly show where price creates matching extremes
Check for confluence: Strong setups occur where multiple pivot lengths align
Wait for price action: Watch for breakouts through equal levels or reversals at these zones
Enter with structure: Use equal levels as entry/exit triggers combined with your trading methodology
Manage with confidence: These levels mark institutional decision points
Customization Options
Adjust pivot lengths to match your preferred timeframe structure
Set ATR threshold sensitivity (lower = stricter equality, higher = more signals)
Toggle confirmation mode for additional filter
Enable/disable individual pivot streams to reduce visual clutter
Customize colors to match your chart theme
Default Settings Optimized For
NASDAQ futures and liquid forex pairs
Intraday and swing trading (1-minute to 4-hour charts)
Smart Money / ICT trading methodologies
Volatility-adjusted confluence detection

Key-Levels - D/W/M High-Low + Fib + MA🧭 Key-Levels – D/W/M High-Low + Fibonacci + Moving Averages
A complete multi-timeframe analysis toolkit that combines Daily, Weekly, and Monthly high/low levels, Fibonacci retracements, and customizable moving averages — all in one clean, efficient display.
Ideal for traders who want to identify key reaction zones, retracement levels, and trend alignment across multiple timeframes.
🔹 Features
1. Prior High/Low Levels
Plots Daily (PDH/PDL), Weekly (PWH/PWL), and Monthly (PMH/PML) key levels
Adjustable colors, styles (Solid / Dashed / Dotted), and line widths
Optional midline display for each timeframe
Displays live labels with price values and % difference from current close
Extend lines rightward to project future price interactions
2. Fibonacci Retracement
Auto-detects swing highs/lows using configurable pivot lengths
Smart pivot logic prioritizes major swings based on % span
Auto-orients retracements depending on trend direction
Customizable visibility and color for each Fibonacci level
Supports 0.236 → 1.618 levels, with optional auto-extension in uptrend scenarios
Displays ratio + price for each level label
3. Pivot Labels
Optionally show pivot high/low labels with customizable text and background colors
Independent control of left/right length and label style
4. Moving Averages
Up to three customizable MAs (default: 8 EMA, 21 EMA, 50 SMA)
Choose between EMA or SMA for each
Toggle individual or all moving averages
Adjustable lengths, colors, and line widths
5. Alerts
Built-in alert condition for price crossing a user-defined level
Clean alert message format with ticker symbol and live price
⚙️ Customization
Flexible style controls for lines, labels, and colors
Adjustable right-extension length for projecting levels
Font size and visibility toggles for all elements
Smart grouping for intuitive settings management
📈 Ideal For
Identifying key reversal or breakout zones
Spotting Fibonacci confluence between retracements and prior highs/lows
Tracking trend structure via multi-timeframe MAs
Swing traders, intraday traders, and technical analysts
💡 Summary
Key-Levels – D/W/M High-Low + Fib + MA is a professional-grade indicator designed to simplify complex multi-timeframe analysis.
It helps you see the bigger picture, find actionable zones, and trade with confidence.
🧩 Compatible with any market and timeframe.

Last 10 Sessions: High, Low, Pivot, GapLast 10 Sessions: High, Low, Pivot, Gap
This indicator highlights the most important price levels from the last 10 completed trading sessions to help intraday and swing traders quickly spot potential support, resistance, and price reaction zones.
Key Features:
Previous Highs and Lows : Visualize the high and low from each of the past 10 sessions. These are the most commonly tested breakout and reversal points for day trading.
Session Pivots: The classic pivot formula ((High + Low + Close) / 3) for each of the last 10 sessions, often acting as a market “equilibrium” or intraday magnet.
Gaps: Displays the difference between each day’s open and the previous session’s close (“gap”), showing sentiment shifts and possible gap fill targets.
Clean, Faded Visuals: All lines and labels are subtly faded so your chart remains clear and uncluttered, with each level labeled by how many sessions ago it occurred.
Full Customization: Instantly toggle any level type (High, Low, Pivot, Gap) ON/OFF in settings, extend lines to the right, and adjust their forward length.
Bulletproof Logic: Never throws runtime errors. Lines and labels only display when valid data is present.
How to Use:
Use recent highs/lows for breakout, breakdown, or mean reversion trades.
Spot where multiple levels from past sessions cluster together for high-probability reversal or breakout areas.
Watch pivots for intraday bias, and gaps for sentiment and possible fill plays.
Perfect for all intraday timeframes.
If you want a powerful yet minimal map of where price is most likely to react, this indicator is for you!
Developed by

Swing High/Low by %REnglish Description
Swing High/Low by %R
This indicator identifies potential swing high and swing low points by combining William %R overbought/oversold turning points with classic swing price structures.
Swing High: Detected when William %R turns down from overbought territory and the price forms a local high (higher than both neighboring bars).
Swing Low: Detected when William %R turns up from oversold territory and the price forms a local low (lower than both neighboring bars).
This tool is designed to help traders spot possible market reversals and better time their entries and exits.
Customizable parameters:
Williams %R period
Overbought & Oversold thresholds
The indicator plots clear signals above/below price bars for easy visualization.
For educational purposes. Please use with proper risk management!
คำอธิบายภาษาไทย
Swing High/Low by %R
อินดิเคเตอร์นี้ใช้ระบุจุด Swing High และ Swing Low ที่มีโอกาสเป็นจุดกลับตัวของตลาด โดยอาศัยสัญญาณจาก William %R ที่พลิกกลับตัวบริเวณ overbought/oversold ร่วมกับโครงสร้างราคาแบบ swing
Swing High: เกิดเมื่อ William %R พลิกกลับลงจากเขต Overbought และราคาแท่งกลางสูงกว่าทั้งสองแท่งข้างเคียง
Swing Low: เกิดเมื่อ William %R พลิกกลับขึ้นจากเขต Oversold และราคาแท่งกลางต่ำกว่าทั้งสองแท่งข้างเคียง
ช่วยให้เทรดเดอร์สามารถมองเห็นโอกาสในการกลับตัวของราคา และใช้ประกอบการวางแผนจังหวะเข้าหรือออกจากตลาดได้อย่างแม่นยำมากขึ้น
ตั้งค่าได้:
ระยะเวลา Williams %R
ค่าขอบเขต Overbought & Oversold
อินดิเคเตอร์จะแสดงสัญลักษณ์อย่างชัดเจนบนกราฟเพื่อความสะดวกในการใช้งาน
ควรใช้ร่วมกับการบริหารความเสี่ยง

FVG, Swing, Target, D/W/M High Low Detector Basic by Trader Riaz"FVG, Swing, Target, D/W/M High Low Detector Basic by Trader Riaz " is a powerful TradingView indicator designed to enhance your trading strategy by identifying key market structures and levels. This all-in-one tool detects Fair Value Gaps (FVGs), Swing Highs/Lows, and previous Day, Previous Week, and Previous Month Highs/Lows, helping traders make informed decisions with ease.
Key Features:
Bullish & Bearish FVG Detection: Highlights Fair Value Gaps with customizable colors, labels, and extension options.
Swing Highs & Lows: Automatically detects and marks Swing Highs and Lows with adjustable display settings and extensions.
Next Target Levels: Identifies potential price targets based on market direction (rising or falling).
Daily, Weekly, and Monthly High/Low Levels: Displays previous day, week, and month highs/lows with customizable colors.
Customizable Settings: Fully adjustable inputs for colors, number of levels to display, and extension periods.
Clean Visuals: Intuitive and non-intrusive design with dashed lines, labels, and tooltips for better chart readability.
This indicator is ideal for traders looking to identify key price levels, improve market structure analysis, and enhance their trading strategies.
Happy Trading,
Trader Riaz
